Aero Testing for Triathletes: How to Measure Your CdA and What It Is Worth
What CdA is, what a lower drag area is worth in minutes at sprint to full distance, how wind tunnels, velodromes, sensors and free field tests compare, and a step-by-step DIY protocol.
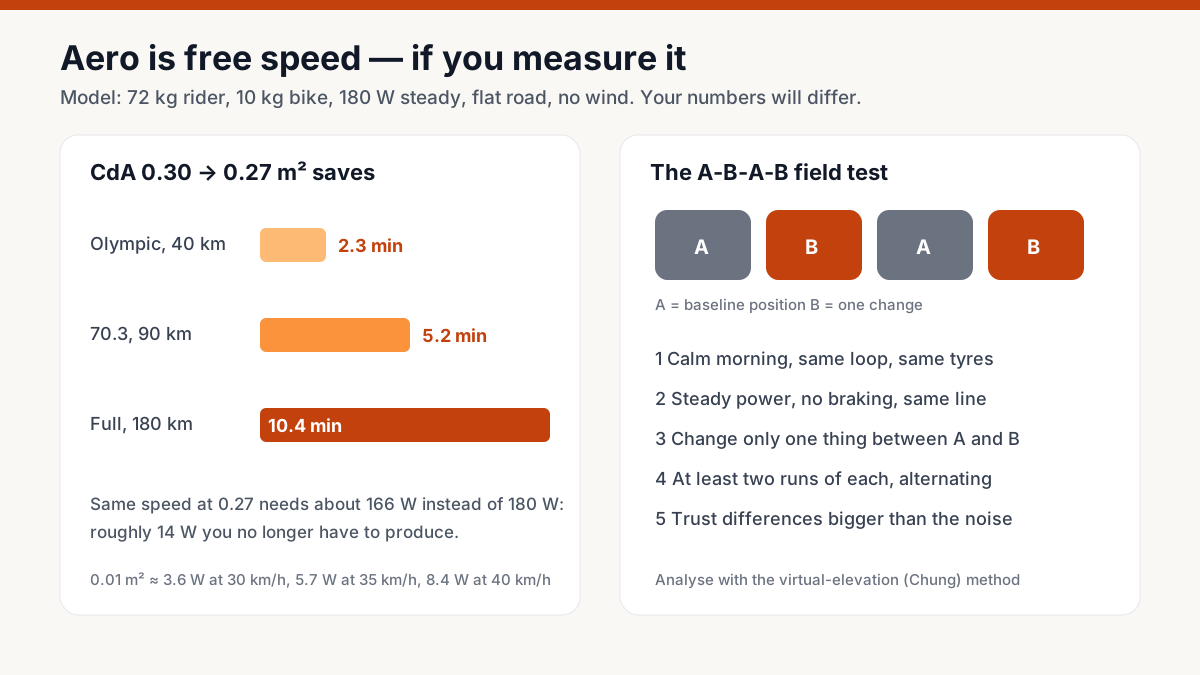
On a flat or rolling triathlon bike course most of your power goes into pushing air, so your drag area (CdA, in square metres) matters far more than a kilo of body or bike weight. In our model a 72 kg rider holding 180 W saves about 5 minutes over a 70.3 bike and about 10 minutes over a full-distance bike by moving from a CdA of 0.30 to 0.27 m². You can measure CdA in a wind tunnel (about £1,250 for two hours in the UK in 2026), on a velodrome (about £285–£895 per session), with an on-bike sensor, or for free with a power meter, a calm road and the virtual-elevation (Chung) method. The test design matters more than the venue: change one thing at a time, alternate positions, repeat runs and only trust differences bigger than the noise.
Key takeaways
- 1CdA is drag coefficient times frontal area. On flat roads aerodynamic drag is usually 70–90% of the resistance a triathlete pushes against
- 2In our model 0.01 m² of CdA is worth about 3.6 W at 30 km/h, 5.7 W at 35 km/h and 8.4 W at 40 km/h
- 3Watts per CdA (W/m²) is the flat-course equivalent of W/kg: it predicts speed far better than power-to-weight on most triathlon bike courses
- 4A free outdoor test with a power meter, a speed sensor and the virtual-elevation method can detect position changes of about 0.005–0.01 m² if the protocol is strict
- 5Wind tunnels and velodromes are more repeatable but cost hundreds of pounds per session; on-bike sensors sit in between and let you re-test
- 6The fastest position is the one you can hold for the whole bike leg and still run off; test endurance and comfort, not just one fast run
Quick answer: is aero testing worth it for a triathlete?
Yes, for most triathletes who race non-drafting events on flat to rolling courses, finding a lower drag position is the cheapest speed you will ever buy. It is also the easiest one to get wrong, because without measuring you cannot tell a faster position from one that only feels faster.
Here is the short version of this guide:
- What you are measuring: CdA, your drag area in square metres. It combines how slippery your shape is (the drag coefficient, Cd) with how much of you faces the wind (frontal area, A). Lower is faster.
- What it is worth: in our model, going from a CdA of 0.30 to 0.27 m² at a steady 180 W saves about 2.3 minutes on an Olympic-distance bike, 5.2 minutes on a 70.3 bike and 10.4 minutes on a full-distance bike. That is the same as finding about 14 W of extra power.
- How to measure it: in rising order of cost, a free outdoor field test with your own power meter, an on-bike aero sensor, a velodrome session or a wind tunnel.
- What decides the result: the test protocol, not the venue. Change one thing at a time, alternate the old and new set-up, repeat each and only believe differences larger than your measurement noise.
If you just want to see what your own numbers mean in speed and time, put them into the bike speed and climb time calculator. The rest of this page explains how to get a trustworthy CdA to put into it.
What CdA actually is, in plain language
When you ride, three forces slow you down: gravity on hills, rolling resistance from your tyres and aerodynamic drag from the air. Drag force is:
drag = ½ × air density × CdA × (air speed)²
You can do nothing about air density (other than race at altitude or in heat, where the air is thinner) and you can only control speed by pedalling harder. CdA is the only term in that equation that is yours to change without getting fitter.
Two things go into it:
- Cd, the drag coefficient: how well air flows around your shape. A rounded helmet tail, a smooth suit and a flat back lower it.
- A, the frontal area: the size of the silhouette you punch through the air. Narrow arms, a lower head and shoulders tucked in lower it.
You almost never measure the two separately; you measure their product. That is why aero testers talk about CdA rather than "drag coefficient".
Typical values give you a feel for the scale. These are approximate ranges drawn from published testing and the starting points used in our calculator, not measurements of you:
| Position | Typical CdA (m²) |
|---|---|
| Upright, hands on the bar tops | about 0.38–0.45 |
| Road bike, hands on the hoods | about 0.30–0.36 |
| Road bike, hands in the drops | about 0.28–0.32 |
| Road bike with clip-on aero bars | about 0.25–0.30 |
| Triathlon or time-trial bike, typical age-group fit | about 0.23–0.28 |
| Well-tested, well-fitted long-course position | about 0.20–0.23 |
The spread inside each row is large. Two athletes on identical bikes can differ by 0.05 m² because of body size, flexibility, helmet and how they hold their head. That is precisely why testing yourself is more useful than reading what someone else achieved.
Why aero matters more than weight on most triathlon courses
Gravity only matters when the road tilts up. Drag matters all the time, and it grows with the square of air speed, so the power it costs grows roughly with the cube. On a flat road at 30–40 km/h, aerodynamic drag takes the large majority of your power; rolling resistance takes most of the rest.
Our model makes the comparison concrete for a 72 kg rider on a 10 kg bike at 180 W over a flat 90 km 70.3 bike course:
| Change | Time saved over 90 km |
|---|---|
| Lose 2 kg of bike or body weight | about 20 seconds on the flat |
| Faster tyres (rolling resistance 0.005 → 0.004) | about 2.5 minutes |
| Lower CdA by 0.01 m² | about 1.7 minutes |
| Lower CdA by 0.03 m² (0.30 → 0.27) | about 5.2 minutes |
| Gain 10 W of sustainable power | about 3.4 minutes |
On a hilly course the balance shifts, because speed on climbs is low and gravity dominates. Our power-to-weight guide shows where that crossover sits. But even on a hilly 70.3 most of the time is spent on flat and rolling road, and the descents and flats are where a good position earns its time back.
That table also makes an important point about value. A 10 W gain in sustainable power is months of training. A 0.03 m² gain in CdA can come from a fit adjustment, a different helmet and a suit that fits, and it does not make you any more tired.
What 0.01 m² of CdA is worth at your speed
Because drag power rises with the cube of speed, the same CdA improvement is worth more watts to a faster rider. From our model at sea-level air density:
| Steady speed | Watts saved by 0.01 m² less CdA |
|---|---|
| 25 km/h | about 2 W |
| 30 km/h | about 3.6 W |
| 35 km/h | about 5.7 W |
| 40 km/h | about 8.4 W |
In time, the picture flips. A slower rider is out on the course longer, so each 0.01 m² saves more minutes even though it is worth fewer watts. At 150 W, 180 W and 220 W in our model, 0.01 m² saves roughly 0.8 minutes over 40 km, 1.7–1.9 minutes over 90 km and 3.3–3.8 minutes over 180 km. The slower you are, the more aero is worth to you in minutes, which is the opposite of what most age-groupers assume.
That is the single strongest argument for back-of-the-pack long-course athletes to care about position: a four-hour 70.3 bike rider or a seven-hour full-distance rider has more to gain from a 0.02 m² improvement than a pro does.
W/CdA: the number that predicts your flat-course speed
Most triathletes know W/kg. Fewer know its flat-course twin, watts per CdA (W/m²). Divide your race power by your CdA and you get one number that predicts speed on a flat road far better than W/kg does.
Some examples from our model, all for the same 82 kg rider and bike:
| Race power | CdA | W/CdA | Flat speed |
|---|---|---|---|
| 180 W | 0.30 | 600 W/m² | about 33.0 km/h |
| 200 W | 0.30 | 667 W/m² | about 34.4 km/h |
| 160 W | 0.24 | 667 W/m² | about 33.7 km/h |
| 180 W | 0.25 | 720 W/m² | about 34.9 km/h |
Notice that the 160 W rider with a CdA of 0.24 is almost exactly as fast as the 200 W rider at 0.30. Their W/CdA is the same. A 40 W fitness gap was erased by position.
Tracking W/CdA over a season is a useful habit. It rewards both training and position work, and it stops you making a position change that is "faster" in a five-minute test but costs you 20 W because you cannot breathe or push in it.
Four ways to measure CdA, compared
There are four practical routes for an age-group triathlete. Prices below are the published 2026 rates from AeroCoach, one of the best-known UK providers, and Cycling Weekly's cost round-up; other countries and providers differ, so treat them as a guide.
| Method | How it works | Typical cost | Repeatability | Best for |
|---|---|---|---|---|
| Wind tunnel | You ride on a fixed bike while a balance measures drag directly at controlled wind speed and yaw | About £1,250 for a two-hour solo session (AeroCoach at Silverstone, 2026) | Very high | Big decisions: new bike, full position overhaul, helmet choice |
| Indoor velodrome | You ride steady laps; power, speed and (with systems such as Garmin's Track Aero System) position are logged and CdA is calculated | About £645 paired to £895 solo for two hours indoors; about £285–£385 at an outdoor track (AeroCoach, 2026) | High, often within about 1–2.5% | Testing in real riding posture, including fatigue and bike handling |
| On-bike aero sensor | An airspeed probe on the bars, combined with your power and speed, estimates CdA as you ride | Hundreds of pounds for the device, plus a power meter | Medium; depends on calm conditions and good power data | Repeated testing and checking your position during training rides |
| Free field test (virtual elevation) | Your own power and speed files from a calm, repeated loop are analysed to back-calculate CdA | Free if you own a power meter and speed sensor | Medium to good with a strict protocol | Anyone with a power meter who wants to compare two or three options |
A few notes on the sensor market, because it has changed quickly. Notio and Aerosensor both make handlebar-mounted units that estimate CdA from airspeed, power and speed. Body Rocket, which promised to measure drag forces directly through sensors in the bars, seatpost and pedals, went into liquidation in June 2026 and never shipped to consumers, so ignore older articles recommending it. Before buying any sensor, check that it works with your head unit and that the maker is still supporting it; most need a reliable power meter, and the best results come from a dual-sided one.
Cheaper still, apps such as myWindsock estimate CdA from rides and weather-station data. These are useful for a rough number and for spotting a big change, but weather data from a station kilometres away is not the wind on your road, so do not chase small differences with them.
The free DIY test: virtual elevation, step by step
The virtual-elevation method, often called the Chung method after the statistician Robert Chung who popularised it in the early 2000s, is the best free tool you have. The idea is simple. If you know your power, speed, mass and rolling resistance, the only unknown left in the physics is CdA. Pick the wrong CdA and the elevation profile the software calculates from your ride will drift upwards or downwards lap after lap. Pick the right one and it matches the real road, which ends every lap at the same height. Free software such as Golden Cheetah's Aerolab tool lets you adjust CdA until the laps line up.
What you need
- A power meter you trust, calibrated (zero-offset) before the test.
- A wheel-based speed sensor. GPS speed is too noisy.
- A head unit that records every second.
- An accurate total mass: you, the bike, bottles, shoes and kit, weighed on the morning.
- Your tyre pressures written down and kept identical through the test.
Where to test
- A loop of 1–3 km, or an out-and-back, that you can ride without braking: no junctions, traffic lights, sharp corners or traffic you need to slow for.
- Ideally a closed circuit, a quiet industrial estate road or a cycle track. Safety first: if you would have to look down at a computer while riding in traffic, choose another venue.
- A gentle rise and fall is fine; the method handles it. Constant stopping is not.
When to test
- Early morning or evening, when wind is lowest. Wind is the enemy: a gust that changes your air speed by 1 m/s ruins a run. Check a forecast for under about 2 m/s.
- A dry day with stable temperature. Note the temperature and air pressure so the software can work out air density.
The protocol
- Warm up for 15–20 minutes on the course, then ride two steady laps in your baseline position (A) to settle.
- Ride the test in blocks: A, B, A, B (or A, B, B, A). B is your one change: a different head position, helmet, arm width or suit.
- Hold a steady power that matches your race effort. Aim for the same speed each run so yaw angles are similar.
- Ride the same line every time. Do not freewheel through sections on some laps and pedal on others.
- Record each block as a separate lap on your head unit, and note what you changed.
- Repeat every position at least twice. Three times is better. Finish with your baseline to check nothing drifted.
The analysis
Load the file into the virtual-elevation tool, enter mass, Crr (start around 0.004–0.005 for good tyres on smooth tarmac) and air density, then adjust CdA until each lap's virtual profile ends where it started. Do it separately for A laps and B laps. The difference is your answer.
A real example of what a tidy outdoor test can show: Cycling Weekly reported a single 12-run session at a motor-racing circuit where a slightly lower head and hand position moved one rider from an estimated CdA of 0.220 to 0.209 m², worth about 8 W at 40 km/h. That is the scale of change a careful DIY test can resolve. It is not the scale a sloppy one can.
How to design a test that tells you the truth
Most bad aero decisions come from tests that could not have answered the question. Five rules prevent that:
- Change one thing at a time. If you swap helmet and lower the bars at once, you will never know which did what. You might keep a change that hurt you because the other one helped more.
- Alternate, do not batch. Riding all A runs and then all B runs confuses your change with whatever changed in the weather between them. A-B-A-B spreads drift evenly.
- Know your noise. Before testing anything, ride four runs of the same set-up. The spread of those CdA values is your noise floor. If your test difference is smaller than that spread, you have found nothing.
- Test at race effort and race duration. A position held for 90 seconds at 300 W is not the position you will hold after three hours at 170 W. Include at least one long block in the position you plan to race, and check whether your head creeps up as you tire.
- Write it down. Date, conditions, mass, pressures, exact change, number of runs, result. A test log turns single sessions into a picture of your season.
Accept that small differences are uncertain. Professional testers often treat anything under about 0.003–0.005 m² as noise unless they have many repeats. For an age-grouper outdoors, look for changes of 0.005–0.01 m² or more.
What to test first: the order that usually pays
Every athlete is different, which is why you test. But the parts of you and your bike that face the wind follow a fairly predictable order of importance. Start at the top of this list:
- Head and shoulders. Your body is roughly three quarters of the total drag of you and your bike. How high your head sits, whether your shoulders are shrugged and how your back is shaped usually matter most. Small changes in pad stack and reach can move CdA a lot.
- Arm position. Narrower pads and hands together or slightly raised often help, but not for everyone. This is the classic thing to A-B test.
- Helmet. The best helmet for you depends on how your head and back line up. A long-tail aero helmet that suits a rider who keeps their head still can be slower on a rider who looks down. Our aero helmet guide covers the trade-offs.
- Clothing. A loose jersey that flaps is slow. A well-fitted one-piece tri suit with sleeves is usually faster than a sleeveless one. See our tri suit guide.
- Bottles and storage. Between-the-arms bottles are often neutral or slightly helpful; frame bottles behind the seat vary. Our bottle placement guide explains what tends to work.
- Wheels and tyres. Deep rims help in many conditions, and fast tyres are worth testing too, though tyre gains show up as rolling resistance more than CdA. See deep versus shallow wheels and our tyre pressure guide.
If you ride a road bike, clip-on aero bars are often the biggest single step you can take, typically moving you from the hoods or drops range into the low-to-mid 0.20s range.
The fastest position is the one you can hold and run off
Aero testing has a trap: the position with the lowest number in a short test is not always the fastest on race day. Three checks keep you honest:
- Can you hold it for the whole bike leg? If you have to sit up every ten minutes to ease your neck or back, your average CdA on the day is much worse than the tested number. Practise in the position on long rides before racing in it.
- Can you still produce your power? A very closed hip angle can cost 10–20 W for some riders. A position 0.01 m² faster that costs 15 W is a net loss at most speeds. That is why W/CdA, not CdA alone, is the number to track.
- Can you run off it? Triathlon bike positions are often a little more open at the hip than time-trial positions for exactly this reason. Use brick sessions to check that the run does not suffer.
If you have not had a professional fit, do that before testing. A good fitter sets a comfortable, powerful base position; testing then refines it. Our guide to whether a bike fit is worth it and the bike fit self-check cover how to start.
Worked example: turning a test into race time
Say you are a 72 kg athlete on a road bike with clip-on bars, racing a flat 70.3 at a planned 180 W. Your field test gives these results, each the average of three runs:
| Set-up | CdA (m²) |
|---|---|
| A: current clip-on position, vented road helmet | 0.300 |
| B: pads 2 cm lower, narrower arms | 0.284 |
| C: B plus a fitted aero helmet | 0.272 |
Your same-set-up repeats varied by about 0.004 m², so the 0.016 m² gain from B is real, and C's extra 0.012 m² is real too.
Put the numbers into the bike speed calculator: at 180 W, 0.300 gives you about 33.0 km/h and a bike split of about 2:43 for 90 km; 0.272 gives you about 34.0 km/h and roughly 2:38. That five-minute gain costs nothing in fitness, provided the lower pads are comfortable on a three-hour ride, which is what your next long training ride should check.
Rules to check before you race a new position
Aero bars and positions are legal in almost all non-drafting age-group triathlons, but the details belong to the rulebook for your race:
- Draft-legal races (most short-course elite and some age-group events) restrict or ban aero bars. Check the event's rules.
- Bike and helmet rules for non-drafting racing are set by the governing body or race series, not by the UCI rules that govern time trials. Triathlon rules are generally more permissive about saddle position and bar extensions, but your helmet must still meet the safety standard named in the rules.
- Concealed hydration and storage must not interfere with your control of the bike.
Our triathlon rules guide collects the main points by governing body.
Common aero-testing mistakes
- Testing in the wind. Even a light, gusty breeze can hide a 0.01 m² change. Postpone rather than test badly.
- Riding different lines or braking on some runs. Every brake touch is lost energy the method blames on drag.
- Forgetting mass. Adding a full bottle between runs changes total mass and confuses the analysis.
- Changing tyre pressure between runs. It changes rolling resistance, which the method then reads as a CdA change.
- Believing one run. One run is an anecdote. Two is a hint. Three or more is data.
- Optimising for a test, not a race. If the lowest number only holds for a lap, it is not your race position.
- Spending on equipment before position. Expensive wheels on a rider with a high head often save less than a free head-position change.
Sources
Sources are listed so readers can verify consequential claims and dated details.
- AeroCoach aero testing and bike fit services and prices — AeroCoach (accessed November 21, 2026)
- Aerodynamic testing for cyclists: what are your options and how much does it cost? — Cycling Weekly (accessed November 21, 2026)
- Gain without pain: the cost-free aero test every cyclist should try — Cycling Weekly (accessed November 21, 2026)
- Body Rocket liquidation: good technology, wrong market — the5krunner (accessed November 21, 2026)
- Aerosensor: the most accurate (and cheapest) handlebar-mounted wind tunnel so far? — Cycling Weekly (accessed November 21, 2026)
- Notio Konect provides all your aero data without a wind tunnel — BikeRadar (accessed November 21, 2026)
Frequently asked questions
What is a good CdA for an age-group triathlete?
On a triathlon or time-trial bike, roughly 0.23–0.28 m² is typical for age-groupers, and the low 0.20s is very good. On a road bike with clip-on bars, 0.25–0.30 m² is typical. Your body size matters, so compare yourself with your own previous tests rather than with other athletes.
How much faster will I be with a lower CdA?
In our model, every 0.01 m² saves roughly 0.8 minutes over 40 km, 1.7–1.9 minutes over 90 km and 3.3–3.8 minutes over 180 km at age-group power levels on a flat course. Use the bike speed calculator with your own weight and power for a personal estimate.
Do I need a power meter to test my aerodynamics?
For a meaningful DIY test, yes. The virtual-elevation method needs accurate power and wheel speed. Without a power meter you can do a rough coast-down comparison on a quiet hill, but the results are much noisier.
Is a wind tunnel better than a velodrome?
A wind tunnel is the most repeatable and can test crosswind (yaw) angles precisely, but you ride on a fixed bike. A velodrome captures how you actually ride, including small movements, at lower cost. Both beat a carelessly run outdoor test; a carefully run outdoor test can be close to a velodrome for big decisions.
How often should I re-test?
After any position change, new helmet, bike or suit, and at least once a season, because flexibility, body shape and habits drift. Many athletes re-check their race position a few weeks before their A race.
Does body weight matter for aerodynamics?
Body size affects frontal area, so heavier and taller riders usually have a higher CdA. But losing weight for aerodynamic reasons is not a sensible strategy; position, helmet and clothing changes are far bigger and carry no health risk.