Triathlon Training Data: Turn Metrics Into Decisions
Learn how to check triathlon training data, interpret heart rate, power, pace, HRV and load models, and make measured decisions with appropriate uncertainty.
By Lotte
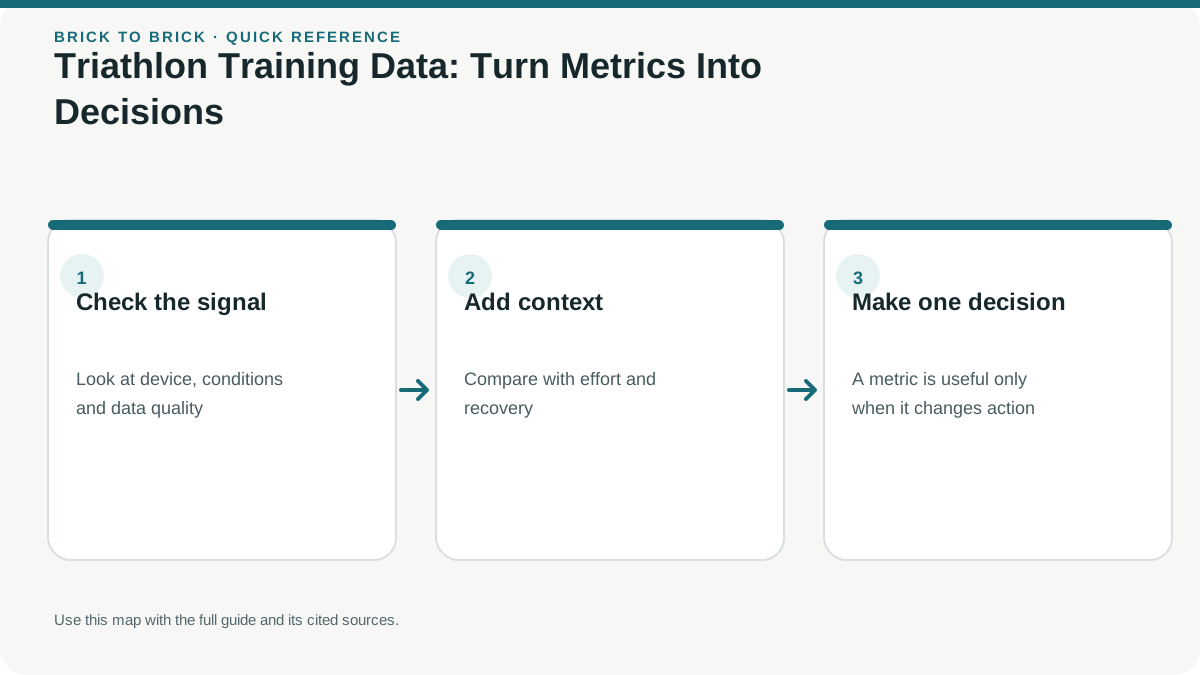
Useful data-driven training begins with a decision, then uses reliable measurements and personal context to inform it. Heart rate, pace, power, HRV and platform load scores measure or model different things; none directly determines injury risk, health or race readiness. Check settings and conditions, compare like with like, and keep symptoms and recovery in view.
Key takeaways
- 1Choose the training decision first and collect only metrics that help answer it.
- 2Heart rate, power, pace and swim data have different measurement limits and depend on correct device settings.
- 3Platform scores such as TSS and CTL are model outputs; their definitions and inputs matter.
- 4HRV-guided research is population- and protocol-specific; one wearable score should not dictate every workout.
- 5Keep subjective context, symptoms and measurement uncertainty alongside the dashboard.
In this article
- 1Write the decision before opening the dashboard
- 2Check the measurement chain
- 3Separate descriptive metrics from model outputs
- 4Use a weekly review with three possible actions
- 5Compare like with like
- 6Know when to override or ignore a score
- 7Use a minimum dashboard for one month
- 8Understand one load calculation before comparing a dashboard
- 9Investigate a surprising result in a fixed order
- 10Heart rate is a response signal, not a direct workload meter
- 11Treat functional threshold power as a setting with uncertainty
- 12Understand what a training-load model smooths over
- 13Use heart-rate variability carefully
- 14Use pace with route and measurement context
- 15Swimming data needs its own quality checks
- 16Combine subjective notes with device data
- 17Do not compare unlike versions of a metric
- 18A worked example: investigate before changing the plan
- 19Use data to adjust a plan, not to invent certainty
- 20Set boundaries around tracking and sharing
- ⚖What common training data can tell you
- ?Frequently asked questions
Write the decision before opening the dashboard
Examples include whether easy rides are becoming too hard, whether a swim change improves repeatability, or whether the current week leaves enough recovery. Each question needs different evidence.
Choose a small set: completed duration, intended versus actual effort, a relevant performance measure and a short note on sleep, symptoms and life stress. Add another metric only when it answers a defined question.
A dashboard is useful when it changes a decision you can explain. Collecting numbers without a question can create false precision and unnecessary anxiety.
Check the measurement chain
Confirm units, device settings, sensor identity and whether stops are included. Running pace in minutes per mile cannot be compared directly with minutes per kilometre. A swim distance can be wrong if the pool length is set incorrectly.
For power, know which device recorded the value and whether averages include zeros. For heart rate, inspect contact issues and dropouts before interpreting a spike. The computer setup guide covers practical checks.
Keep equipment changes in the log. A new sensor can create a new baseline rather than a sudden physiological improvement.
Separate descriptive metrics from model outputs
Duration and distance describe recorded work, subject to device error. Training-load, fitness, fatigue and readiness scores are models built from inputs and assumptions. Different platforms can produce different scores from the same week.
A model can make trends easier to see, but its number is not a direct measurement of injury risk or race readiness. A “good” score does not clear chest pain, illness or persistent exhaustion.
Read the platform's definitions before comparing scores. Do not mix values calculated by different methods into one trend line without acknowledging the change.
Use a weekly review with three possible actions
Review what was planned, what happened and how you recovered. Choose to continue, repeat or reduce the next block. A week need not progress simply because the calendar advances.
For example, if duration was stable but easy sessions felt harder and sleep was disrupted by work, repeating or simplifying the week may be reasonable. If a single poor ride occurred in strong wind, it may not justify changing the whole programme.
Write the reason for the action so you can review it later. The point is an explicit decision process, not a claim of certainty about cause.
Compare like with like
Use similar routes, conditions, equipment and session purposes when comparing performance. Note changes in temperature, terrain, stops and fatigue. A personal best downhill segment does not necessarily indicate better endurance.
For swim technique, compare repeatable efforts rather than one fastest length. For cycling, compare power with context. For running, include how the effort felt and whether you recovered normally.
Use the FTP guide and VO2 max explainer for the limits of those particular estimates.
Know when to override or ignore a score
Stop and seek appropriate help for concerning symptoms regardless of the dashboard. Simplify tracking if it encourages compulsive checking, food restriction or training through illness.
A coach can help interpret competing signals, but should explain the decision rather than merely repeat the software's recommendation. Share the raw context as well as the headline score.
Keep the minimum tracking that supports consistent training. The desired result is a clearer next action and a record you can learn from, not the largest possible archive of numbers.
Use a minimum dashboard for one month
Choose a small set of fields you can interpret: session duration, discipline, perceived effort and a short note about recovery or symptoms. Add a device metric only when it answers a question the basic record cannot.
At the weekly review, choose one of three actions: continue because the pattern is manageable; simplify because fatigue or logistics are accumulating; investigate because a measurement or symptom is unusual. Write the reason in plain language. That makes it possible to review whether the decision helped.
Avoid backfilling missing sessions with invented intensity just to make a chart complete. Mark unknown data as unknown. If a platform changes its model or you change devices, annotate the break in comparability. The quality of a training decision depends on the meaning and reliability of the inputs, not the number of coloured graphs available.
Understand one load calculation before comparing a dashboard
For power-based Training Stress Score, TrainingPeaks describes a model combining duration and intensity relative to a threshold reference. A commonly used equivalent expression is hours × intensity factor² × 100, where intensity factor is normalised power divided by FTP. This formula belongs to that particular model; it is not a universal measure of biological stress.
With an illustrative one-hour ride at an intensity factor of 0.75, the calculation gives 1 × 0.75² × 100 = 56.25. Changing the FTP reference changes the intensity factor and therefore the score even when the recorded ride is identical. A threshold update can alter the interpretation of the chart without representing a sudden physical change.
Do not combine unlike metrics as if their units were interchangeable. A platform may calculate running or swimming load differently, and another provider may use a separate proprietary model. Check which activity and method produced each value.
The model can help describe training consistently when its inputs are appropriate. It cannot directly measure every source of fatigue, prove that you absorbed a session or diagnose overtraining. Keep the calculation beside ordinary observations of performance, symptoms, recovery and life demands.
Investigate a surprising result in a fixed order
First inspect the activity file: duration, pauses, units, sensor dropouts and whether the correct sport was recorded. Next check settings such as FTP or heart-rate zones. Then compare context: heat, hills, indoor cooling, equipment changes and recent fatigue. Only after those checks should you interpret the result as evidence of changed fitness.
For example, a low power average caused by repeated sensor dropouts should not trigger harder targets at the next workout. A higher heart rate on a warmer day does not by itself establish a decline in fitness. A single unusually fast GPS split may reflect location error rather than a new running capability.
Keep an annotation when you correct or exclude a file so a later review can understand the decision. Avoid editing data simply to make a training chart look consistent. Unknown or unreliable information should remain identifiable.
If the surprising result concerns symptoms rather than only numbers, prioritise appropriate assessment. A dashboard review is useful for measurement questions; it is not a safe way to dismiss chest pain, fainting, unusual breathlessness or persistent deterioration in function.
Heart rate is a response signal, not a direct workload meter
Heart rate can help describe how your body responded to a session, especially during steady efforts, but it is influenced by more than external work. Temperature, hydration, illness, stress, sleep, medication, caffeine and measurement quality can change the recorded value. A higher number on a hot day does not by itself prove that fitness fell; a lower number does not prove that the session was easy or safe.
Check that the device is reading consistently and that your zones come from an appropriate method. Age-based formulas and unverified threshold estimates can place a workout in the wrong zone. Heart rate also responds with a delay when effort changes, so it may not describe a short interval as promptly as perceived effort or a power meter.
Use the number alongside pace, power, route, conditions and how the session felt. If the value is surprising, first check sensor contact, settings and the activity file. Persistent changes paired with symptoms deserve clinical attention, not a zone adjustment.
Treat functional threshold power as a setting with uncertainty
A cycling power threshold is a reference used by a plan or software to define zones and calculate some workload scores. It is not a fixed biological constant. The value depends on the test protocol, equipment, environment, pacing, fatigue and how a threshold is estimated. Two tests using different protocols may not produce interchangeable values.
If the threshold in the app is too high or too low, every threshold-relative session may be labelled differently. A new number can make yesterday's ride appear more or less demanding even though the recorded power has not changed. Keep a note of the date, test method, device and setting whenever you update a threshold.
Use a test or estimate that matches the training system you follow, and avoid changing the number just to make planned sessions appear achievable. A threshold test is not appropriate when you are ill, injured or experiencing concerning symptoms. The FTP test guide describes how test method and interpretation affect the estimate.
Understand what a training-load model smooths over
Some training platforms calculate rolling or weighted summaries from workout scores. TrainingPeaks, for example, describes Chronic Training Load, Acute Training Load and Training Stress Balance as modelled summaries derived from its training-stress framework. They can help visualize changes over time, but their labels do not mean that the software directly measured your biological fitness, fatigue or race readiness.
A model also inherits the limitations of its inputs. If heart-rate zones, functional threshold power, pace, activity duration or sensor files are wrong, the summary may look precise while representing a poor estimate. Different platforms can smooth the same week differently, and a metric called “load” may be defined differently between devices.
Use the chart to ask a question—such as whether the recent training pattern changed—not to obey a particular score. If the chart says “fresh” but you feel ill or unusually exhausted, pay attention to the real-world context. If it says “fatigued” after a deliberate recovery week, inspect the inputs and model before cancelling a sensible plan.
Use heart-rate variability carefully
Heart-rate variability (HRV) is a measure derived from timing differences between heartbeats. Some athletes use a repeated resting measure as one part of a training decision, but a single daily number is noisy and does not diagnose recovery, illness or readiness. Timing, posture, breathing, device, algorithm and recent conditions affect whether two measurements are comparable.
Research has tested HRV-guided endurance training, but the study population and protocol matter. One randomized trial with 40 recreational endurance runners compared a periodized plan with timing of harder sessions guided by morning HRV; it does not establish that every watch's overnight score should dictate a triathlete's workout. The study record describes its method and participants.
If you choose to track HRV, use the same method consistently and combine the trend with how you feel, sleep and training context. Do not change medication or use a low score to diagnose illness. If tracking creates worry or compulsive checking, simplify or stop collecting it.
Use pace with route and measurement context
Running pace is useful when distance and time are measured well, but GPS tracks can differ because of route geometry, tunnels, tree cover, buildings, sampling and how an app smooths data. Short intervals amplify small distance or timing errors. A hilly route, soft surface, wind or heat also changes what the same pace demands from you.
Compare a pace metric only with a similar route and session purpose. Check the map for obvious track errors, confirm whether the workout includes stops, and note conditions. If you need repeatability for a short interval, a measured track or known route may provide clearer information than an instantaneous GPS pace display.
Do not set a faster training target from one unusually quick split. Look for a repeatable pattern and consider effort and recovery. For race analysis, compare the official course and timing information as well as the device record; a watch trace is not a substitute for a surveyed race distance.
Swimming data needs its own quality checks
Swim metrics are produced differently from bike and run metrics. A pool watch depends on the pool length being set and may count lengths imperfectly when you change strokes, pause at the wall or use drills. Open-water distance estimates rely on movement and signal processing while the watch is often below the surface. Pace per 100 metres can therefore be less stable than a measured pool interval.
For technique work, note the set, rest, stroke focus and perceived control, not just the fastest length. A pace change may reflect longer rests, a different pool, a different stroke count rule or missed turns. Keep pool and open-water sessions separate when comparing trends unless you have a reason to combine them.
If the question is whether a technique change helped, repeat a manageable set in the same pool with similar rest and effort. Ask a coach to observe the stroke if technique is central. A speed number cannot show whether you are relaxed, safe or swimming a suitable line in open water.
Combine subjective notes with device data
Perceived effort and a short note about sleep, soreness, mood, heat or life stress add information that a workout file may not contain. A device does not know that you slept poorly because of caregiving, had a cold coming on, or felt unusually anxious about the session. Nor does a subjective note need to be translated into a complicated score to be useful.
Use plain language and the same few prompts over time. For example: “easy ride, legs normal, unusually warm,” or “run felt hard at usual easy pace after travel.” Those notes help you interpret whether a change in pace or heart rate might relate to conditions. They do not prove cause, but they keep the data attached to the person who produced it.
Avoid tracking so many feelings that the log becomes another source of pressure. Choose observations that help answer your original question. If a score encourages you to ignore how you feel, use fewer metrics or discuss the conflict with a coach.
Do not compare unlike versions of a metric
Two charts with the same label can use different inputs or formulas. One platform's cycling TSS can rely on power and an FTP setting, while another may use heart rate, pace or a proprietary model. Even within one service, run and swim scores can be calculated differently from bike power scores. Their numbers are not automatically interchangeable.
When switching devices, services or data sources, record the date and treat it as a possible break in the trend. A new watch may sample differently; a new app may apply different smoothing; an updated threshold may change future training scores. Do not stitch both series together without a note about the method change.
If comparing two athletes, remember that a similar score can represent different sessions, bodies and settings. Use the metric to organize your own observations, not to rank who trained harder. A coach or training partner can discuss the session purpose without assuming that one number means the same thing for everyone.
A worked example: investigate before changing the plan
Imagine an athlete notices that several easy runs show a higher heart rate and a larger load score than last month. The first conclusion should not be “fitness is falling” or “the plan is unsafe.” The athlete can inspect the files: Were the routes the same? Did the watch record accurately? Were the threshold and heart-rate zones changed? Was the weather warmer? Were runs following harder bike days?
Suppose the files are valid, the runs were warmer and the athlete also reports poor sleep during a work deadline. Those facts make the comparison less direct. The athlete might keep the planned easy effort, choose a cooler time or repeat the week, then review the next similar session. That is a hypothetical example of a decision process, not a universal prescription.
If the pace remains unexpectedly difficult after conditions normalize, or symptoms occur, the athlete can reduce training and seek appropriate professional advice. The numbers prompted a useful question; they did not identify the cause. Label examples like this as hypothetical because they are not observed patient or athlete data.
Use data to adjust a plan, not to invent certainty
A training log can support small decisions such as repeating a week, changing a session location, checking equipment or asking a coach about a pattern. It cannot guarantee that an athlete will avoid injury or identify exactly when a fitness breakthrough will happen. Training response is not a simple graph where every increase in load creates a predictable gain.
Avoid applying arbitrary thresholds from social media, such as a universal acute-to-chronic ratio or a single HRV change that means “do not train.” A score can be a prompt to review context, but no dashboard contains every health, environmental and life factor. The software provider's own definitions help explain what its score represents; they do not turn a model into a diagnosis.
Use the smallest adjustment that fits the evidence, then observe what happens. If the inputs are reliable and the pattern repeats, you have more reason to discuss a change with your coach. If the data are sparse or inconsistent, mark uncertainty and avoid overreacting. A clear “not enough information yet” is a sound decision.
Set boundaries around tracking and sharing
Tracking should support training, not take over the experience. Decide which sessions need detailed recording and which can be completed by feel. You do not need a device on every swim, an exact calorie record or a readiness score before every workout. If checking metrics is affecting sleep, mood, eating or relationships, reduce the tracking and seek support when needed.
Before sharing data with a coach, team or public platform, understand what the file contains: location, timestamps, route, heart rate and other personal information may reveal routines or home locations. Use privacy settings that match what you want to share. Ask a coach which fields they actually need and how the data will inform a decision.
Do not use a spreadsheet to supervise another athlete's health without consent or qualification. If a teammate shares a concerning symptom, encourage them to contact an appropriate professional rather than trying to interpret their file. Clear boundaries make data use more respectful and useful.
What common training data can tell you
| Data type | What it records or estimates | Key context to check |
|---|---|---|
| Duration and distance | Time and route or pool work recorded | Stops, route, pool length, device settings |
| Heart rate | Cardiac response measured by a sensor | Sensor quality, threshold zones, heat, illness and medication |
| Power | Mechanical power from the specified device | Device location, dropouts, calibration and FTP reference |
| Pace | Time relative to measured distance | GPS route, terrain, surface and smoothing |
| HRV | Beat-to-beat variation summarized by a method | Consistent protocol, personal trend and other observations |
| TSS or readiness score | A platform's model based on selected inputs | Provider formula, input quality and intended scope |
Sources
Sources are listed so readers can verify consequential claims and dated details.
- Training Stress Scores explained — TrainingPeaks (accessed September 24, 2026)
- Sleep and the athlete: narrative review and 2021 expert consensus recommendations — British Journal of Sports Medicine / PubMed (accessed September 24, 2026)
- Intensity Factor explained — TrainingPeaks (accessed September 24, 2026)
- Individual endurance training prescription with heart rate variability — Medicine & Science in Sports & Exercise / PubMed (accessed September 24, 2026)
- Individualized endurance training based on recovery and training status in recreational runners — International Journal of Sports Physiology and Performance / PubMed (accessed September 24, 2026)
Frequently asked questions
Which metrics should a triathlete track?
Start with the question you need to answer. A simple record of session duration, sport, perceived effort and relevant recovery context may be enough; add power, heart rate, pace or another metric only when it serves a clear purpose.
What does TSS mean in triathlon training?
Training Stress Score is a platform-specific estimate based on duration and intensity inputs. TrainingPeaks uses different methods depending on the data available for cycling, running and swimming. It is not a direct measurement of all biological stress.
Can HRV tell me whether I should train today?
HRV can be one repeated observation in a decision process, but its meaning depends on measurement method, personal baseline and context. Research protocols do not automatically validate every wearable's readiness score.
Does a high training-load score mean I am fit or fatigued?
Not directly. Scores such as CTL, ATL and TSB are modelled summaries based on training inputs and assumptions. They can help describe trends but do not diagnose fatigue or establish race readiness.
Why did my training score change after I changed devices?
The sensor, recording settings, threshold references or platform formula may differ. Treat the change as a possible break in comparability, record the new method and avoid interpreting it as a sudden physiological shift.
Should I train through symptoms if my watch says I am ready?
No. A favorable device score cannot clear illness, injury, chest pain, faintness or unusual breathlessness. Stop and seek appropriate health advice for concerning symptoms.